Pandas教程
介绍
pandas 是一个 Python 包,它提供快速、灵活且富有表现力的数据结构,旨在使“关系”或“标记”数据的处理变得简单直观。 它的目标是成为用 Python 进行实际、真实世界数据分析的基本高级构建块。 此外,它还有更广泛的目标,即成为任何语言中最强大、最灵活的开源数据分析/操作工具。 它已经在朝着这个目标前进。
pandas 非常适合下列这些类型的数据:
- 具有异构类型列的表格数据,如 SQL 表或 Excel 电子表格
- 有序和无序(不一定是固定频率)时间序列数据
- 带有行和列标签的任意矩阵数据(同质类型或异构)
- 任何其他形式的观察/统计数据集。数据根本不需要被标记就可以放入 pandas 数据结构中
主要特点
pandas 的两种主要数据结构Series(一维)和DataFrame(二维)处理金融、统计、社会科学和许多工程领域的绝大多数典型用例。对于 R 用户,DataFrame提供 R data.frame提供的一切以及更多。pandas 构建在NumPy之上,旨在与许多其他第三方库在科学计算环境中良好集成。
以下是 pandas 擅长的一些事情:
- 轻松处理浮点和非浮点数据中的缺失数据(表示为
NaN、NA或NaT) - 大小可变性:可以从
DataFrame和更高维对象中插入和删除列 - 自动和精确的数据对齐:对象可以准确地与一组数据对齐,或者用户可以简单地忽略数据并让
Series、DataFrame等在计算中自动为您对齐数据 - 强大、灵活的分组功能,可对数据集执行拆分-应用-组合操作,以聚合和转换数据
- 可以轻松地将其他
Python和NumPy数据结构中的不规则、不同索引的数据转换为DataFrame对象 - 基于智能标签的切片、高级索引和大数据集的子集
- 直观的合并和连接数据集
- 灵活的重塑和翻转数据集
- 坐标轴的分层标签(每个刻度可能有多个标签)
- 强大的
IO工具,用于从平面文件(CSV and delimited)、Excel文件、数据集以及从超快HDF5格式保存或加载的数据
安装
pandas 可以通过PyPI中的 pip 安装。
1 | pip install pandas |
pandas 处理什么样的数据?
导包
1 | import pandas as pd |
pandas 数据表表示
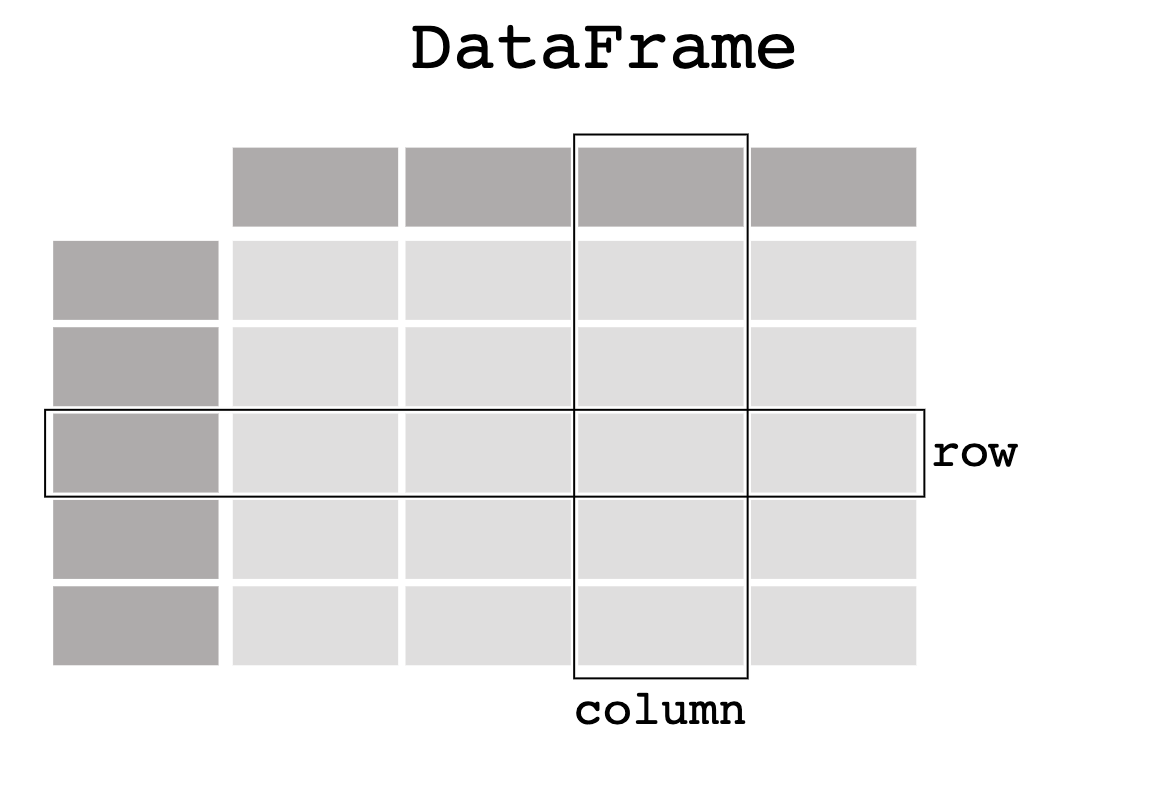
示例:
1 | import pandas as pd |
输出:
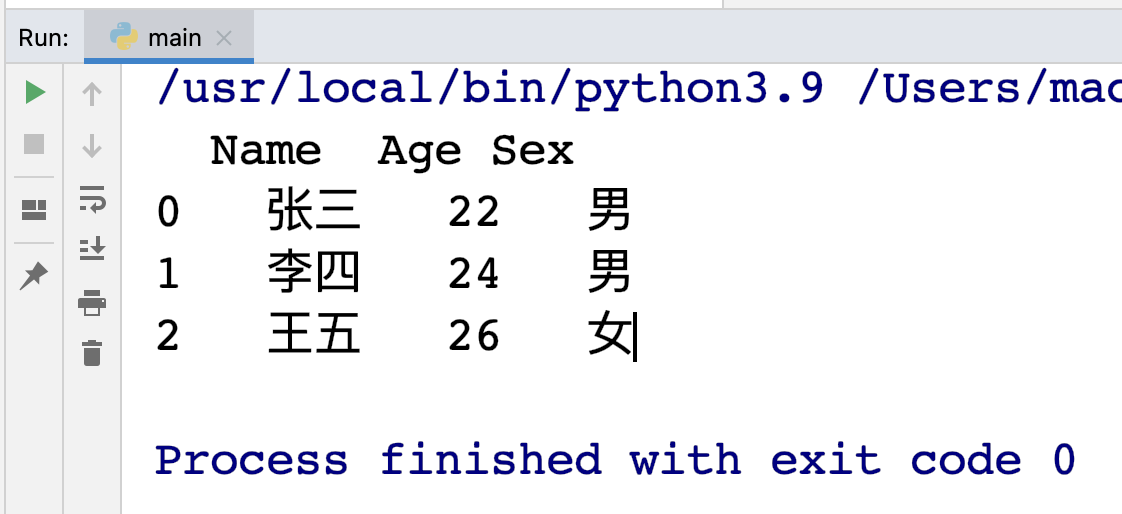
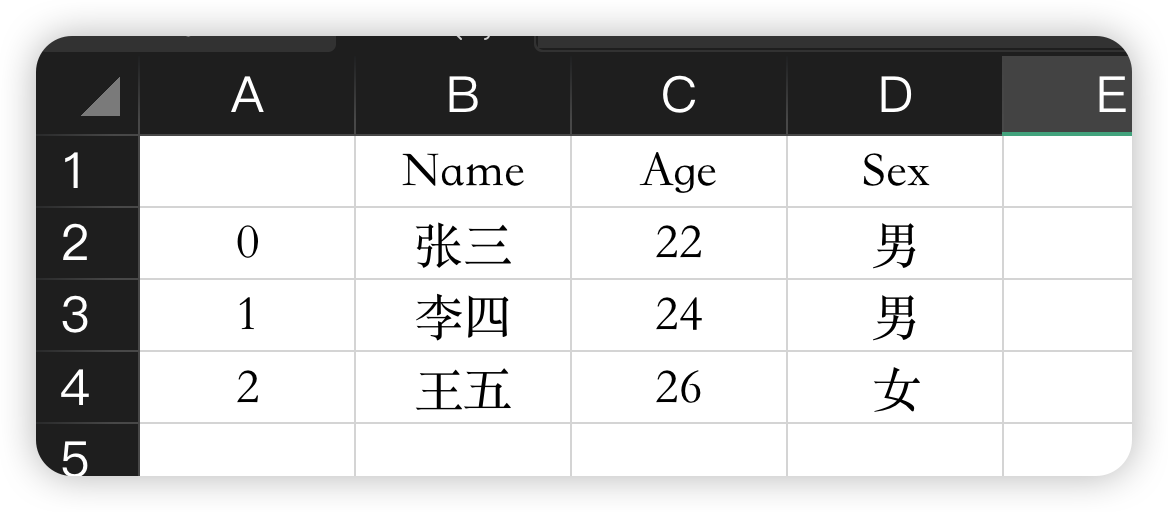
在电子表格软件中,我们数据的表格表示看起来非常相似:
DataFrame中每一列都是一个 Series

如果只对Name这一列的数据感兴趣:
1 | pring(df["Age"]) |
输出:
1 | 0 22 |
当选择DataFrame中的单列时,结果是 Series。要选择列,请使用方括号之间的列标签[]。
创建Series:
1 | ages = pd.Series([20, 30, 40], name="Age") |
输出:
1 | 0 20 |
使用 DataFrame 或 Series 做一些事情
我想知道谁的年龄最大?
DataFrame我们可以通过选择Age列并应用max()函数:
1 | ages = pd.Series([20, 30, 40], name="Age") |
输出:
1 | 40 |
DataFrame和Series还有许多其他函数供我们使用,可以通过下面链接进行查看。
假如我们只对数据表的数值数据的一些基本统计感兴趣:
1 | print(df.describe()) |
Out:
1 | Age |
describe() 方法可快速浏览 DataFrame 中的数字数据。由于Name和Sex列是文本数据,因此 describe() 方法默认不考虑这两列。
如何读写表格数据?
数据集:
本教程使用成人人口普查收入数据集,存储为 csv 文件。如下所示:

Pandas提供了read_csv()函数将Excel文件读取为DataFrame对象。
pandas 支持许多不同的文件格式或开箱即用的数据源(csv、excel、sql、json、parquet…),读取每个文件格式或数据源都使用带有前缀read_*的函数。
1 | adult = pd.read_csv("data/adult.csv") |
Out:
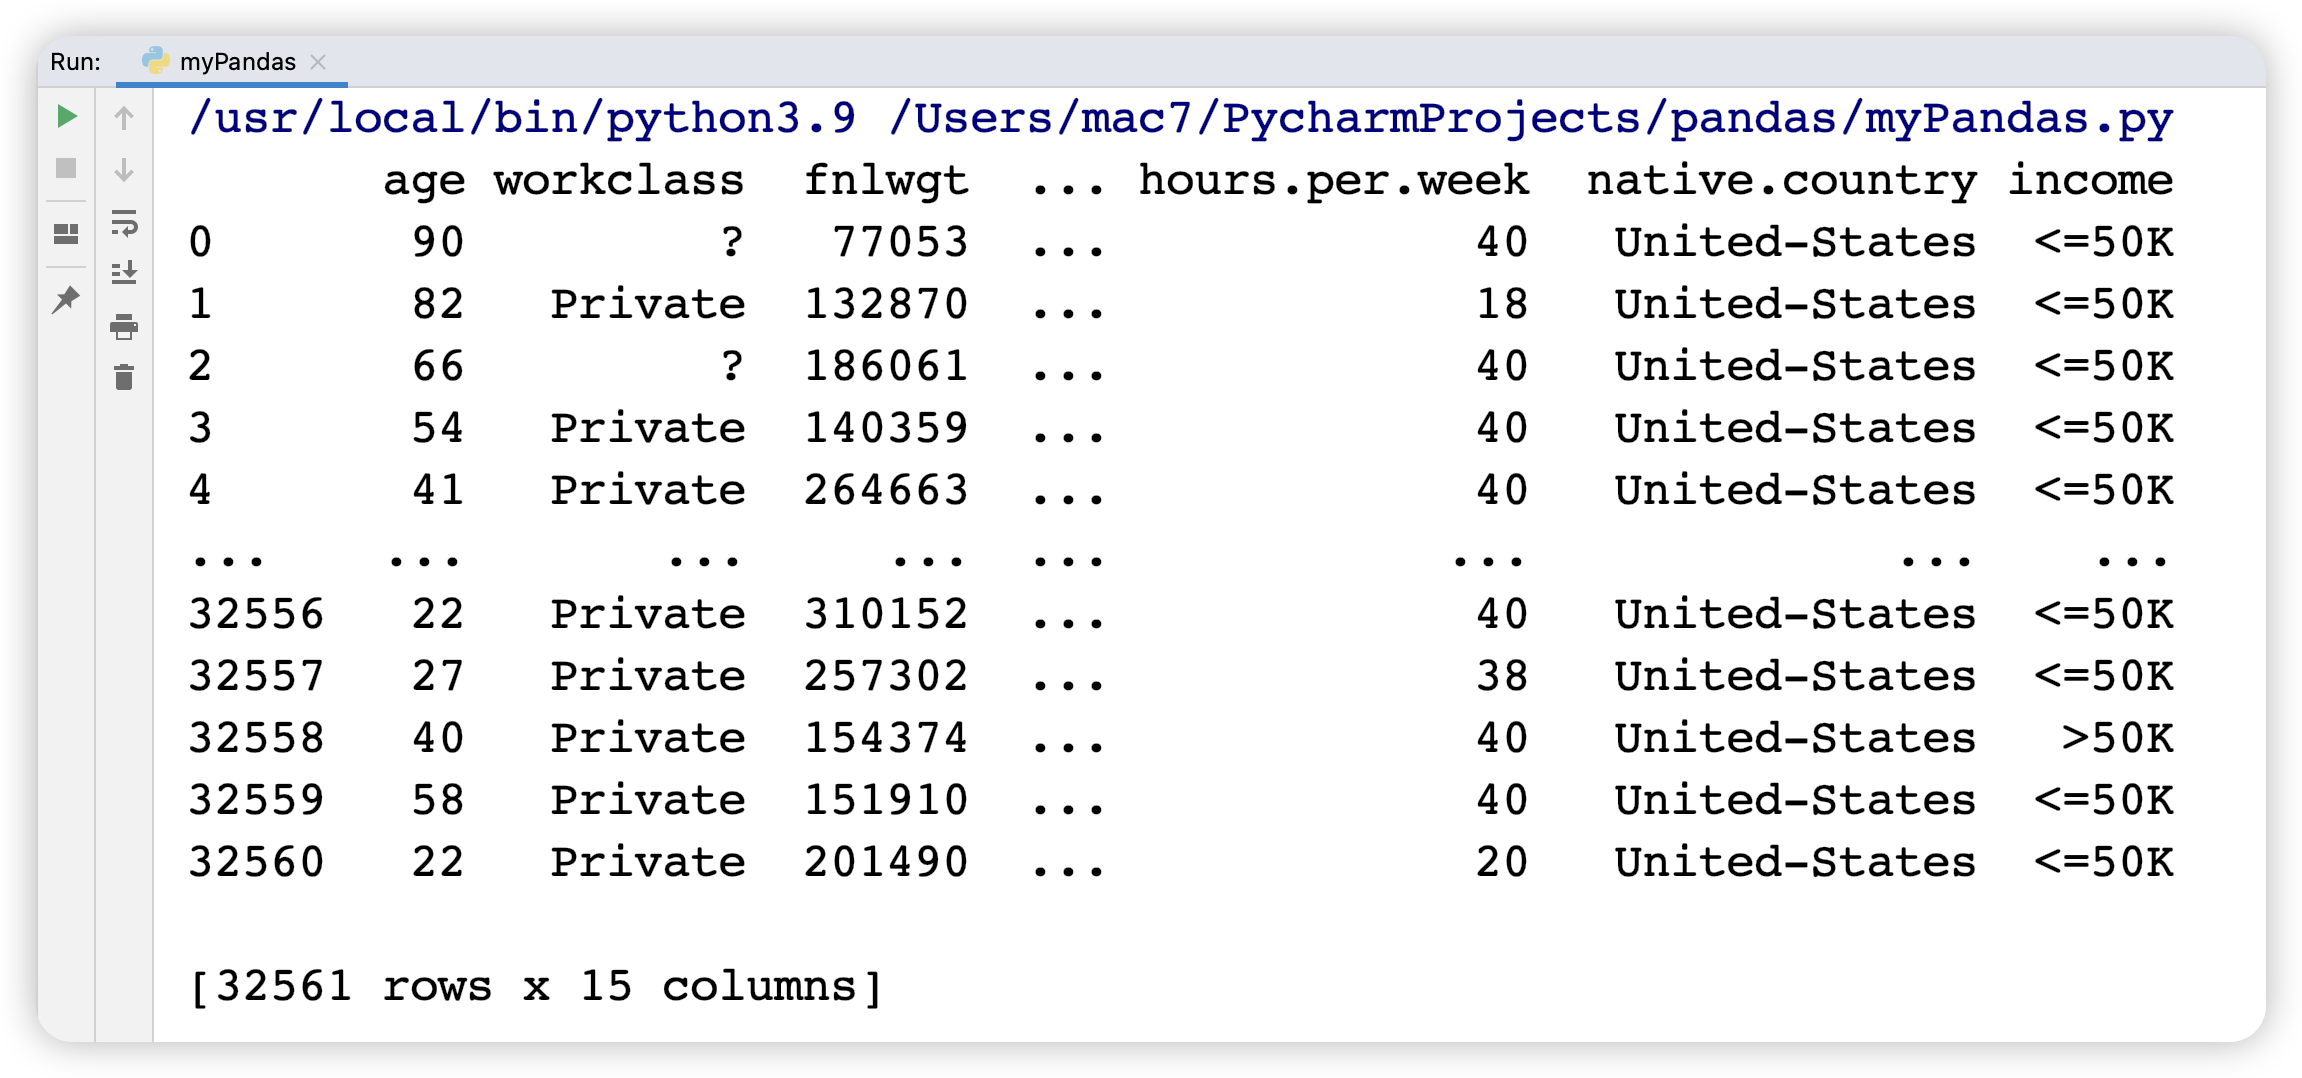
请确保读完数据之后总是有一个数据检查。显示 DataFrame 时,默认显示前 5 行和后 5 行。
要查看 DataFrame 的前 N 行,请使用该 head() 方法并以所需的行数作为参数。
我想查看 pandas DataFrame 的前 8 行。
1 | print(adult.head(8)) |
Out:
1 | age workclass fnlwgt ... hours.per.week native.country income |
对最后 N 行感兴趣吗?pandas也提供了一种 tail() 方法。例如,adult.tail(10)将返回 DataFrame 的最后 10 行。
可以通过请求 pandas dtypes 属性来检查 pandas 如何解释每个列数据类型:
1 | print(adult.dtypes) |
Out:
1 | age int64 |
对于每一列,都会列出所使用的数据类型。其中的数据类型DataFrame为整数 ( int64)和字符串 ( object)。
将DataFrame保存为Excel文件:
1 | adult.to_excel("adult.xlsx", sheet_name="person", index=False) |
read_*函数常用于读取函数到Pandas中,而to_*函数常用于存储数据。
该to_excel()方法将数据存储为 Excel 文件。在此示例中,sheet_name名为“person”而不是默认的“Sheet1”。通过设置 index=False行索引标签不会保存在电子表格中。
读取函数read_excel()会将数据重新加载到 DataFrame:
1 | adult = pd.read_excel("adult.xlsx") |
Out:
1 | age workclass fnlwgt ... hours.per.week native.country income |
我对 DataFrame 的技术摘要感兴趣
1 | print(adult.info()) |
Out:
1 | <class 'pandas.core.frame.DataFrame'> |
info()方法提供了有关 DataFrame 的技术信息 ,因此让我们对输出作出更详细地解释:
- 它确实是一个
DataFrame - 有 32561 个
entries,即 32561 行 - 每行都有一个行标签(也称为
index),其值范围为 0 到 32560 - 该表有 15列。大多数列的每一行都有一个值(所有 32561 个值都是
non-null) workclasseducationmarital.statusoccupationrelationshipracesexnative.countryincome列都是由文本数据组成(String 又称 Object)- 其他列是数值数据,其中一些是整数(又名
integer) - 不同列中的数据类型(字符、整数……)通过
dtypes列出 - 还提供了用于保存 DataFrame 的大致 RAM
选择DataFrame的子集
如何选择DataFrame的特定列?

假如我们只对Age感兴趣:
1 | adult = pd.read_excel("adult.xlsx") |
Out:
1 | 0 90 |
DataFrame 中的每一列都是一个Series。当选择单个列时,返回的对象是 pandas Series。我们可以通过检查输出的类型来验证这一点:
1 | print(type(adult["age"])) |
Out:
1 | <class 'pandas.core.series.Series'> |
看看shape输出:
1 | print(adult["age"].shape) |
Out:
1 | (5,) |
DataFrame.shape是 Series、DataFram 的一个属性。DataFrame包含行数和列数:(nrows, ncolumns)。pandas Series 是一维的,仅返回行数。
假如对年龄和性别感兴趣:
1 | age_sex = adult[["age", "sex"]] |
Out:
1 | age sex |
返回的数据类型是 pandas DataFrame:
1 | print(type(age_sex)) |
Out:
1 | <class 'pandas.core.frame.DataFrame'> |
In:
1 | print(age_sex.shape) |
Out:
1 | (5, 2) |
返回的DataFrame具有5 行 2 列。
如何选择DataFrame的特定行?
假如对 60岁以上的客户感兴趣。
1 | print(adult[adult["age"] > 60]) |
Out:
1 | age workclass fnlwgt ... hours.per.week native.country income |
括号内的条件 adult["age"] > 60 检查哪些行 Age 列的值大于 60:
1 | print(adult["age"] > 60) |
Out:
1 | 0 True |
条件表达式(也可以是 ==, !=, <, <=,… )的输出实际上是一组pandas Series的布尔值(True或False),
其行数与原始 DataFrame 相同 。这样的一系列布尔值可用于将其放在选择括号 [] 之间来过滤 DataFrame, 仅选择值为 True 的行。
假如我们只对native.country是China和India的用户感兴趣。
1 | country = adult[adult["native.country"].isin(["China", "India"])] |
Out:
1 | age workclass fnlwgt ... hours.per.week native.country income |
与条件表达式类似,isin() 条件函数为匹配条件列表中的每一行返回 True。要根据此类函数过滤行,请使用括号内的条件函数,括号内的条件函数检查native.country是China或India的行。
与下列等价:
1 | country = adult[(adult["native.country"] == "China") | (adult["native.country"] == "India")] |
Out:
1 | age workclass fnlwgt ... hours.per.week native.country income |
假如我们只对年龄已知的用户感兴趣。
1 | adult = pd.read_excel("adult.xlsx") |
Out:
1 | age workclass fnlwgt ... hours.per.week native.country income |
notna() 条件函数对于值不是 Null 值的每一行返回 True。 因此,可以结合选择括号[]来过滤数据表。
如何选择DataFrame的特定行和列?

假如对35 岁以上人员的性别感兴趣。
1 | adult_names = adult.loc[adult["age"] > 35, "sex"] |
在这种情况下,行和列的子集是一次性生成的,仅使用括号选择
[]已经不够了。 选择括号[]前面需要loc/iloc运算符。 使用loc/iloc时,逗号之前的部分是您想要选择的行,逗号之后的部分是您想要选择的列。
使用列名、行标签或条件表达式时,请在选择括号 [] 前面使用 loc 运算符。 对于逗号之前和之后的部分,您可以使用单个标签、标签列表、标签切片、条件表达式或冒号。 使用冒号指定您要选择所有行或列。
假如对第 10 行到第 25 行和第 3 到第 5 列感兴趣。
1 | print(adult.iloc[9:25, 2:5]) |
Out:
1 | fnlwgt education education.num |
同样,行和列的子集是一次性生成的,仅使用选择括号 [] 已经不够了。 当根据表中的位置对某些行和/或列特别感兴趣时,请在选择括号 [] 前面使用 iloc 运算符。
当使用 loc 或 iloc 选择特定行和/或列时,我们对我们所选的特定行和/或列赋值。
例如,要将前三行人员的年龄统一改成20:
1 | adult.iloc[0:3, 0] = 20 |
Out:
1 | age workclass fnlwgt ... hours.per.week native.country income |
Remember:
要选择数据子集时,使用方括号[]。在括号内,您可以使用单个列/行标签、列/行标签列表、标签切片、条件表达式或冒号。通过 loc 使用行名和列名选择特定的行和列。通过 iloc 使用坐标轴位置选择特定的行和列。你可以为 loc 或 iloc 选择的行或列赋新值。
如何在 pandas 中创建绘图?

导入相关类库:
本教程使用的数据:空气质量数据
在本教程中,使用了有关的空气质量数据,这些数据由 OpenAQ 提供并使用 py-openaq 包。 air_quality_no2.csv 数据集提供了分别位于巴黎、安特卫普和伦敦的测量站 FR04014、BETR801 和伦敦威斯敏斯特的值。

读取数据:
1 | air_quality = pd.read_csv("data/air_quality_no2.csv", index_col=0, parse_dates=True) |
Out:
1 | station_antwerp station_paris station_london |
read_csv 函数的 index_col参数表示将第一(第 0)列定义为结果 DataFrame 的索引。
read_csv 函数的 parse_dates参数表示将列中的日期转换为 Timestamp 对象。
通过视图快速的检查数据:
1 | air_quality = pd.read_csv("data/air_quality_no2.csv", index_col=0, parse_dates=True) |
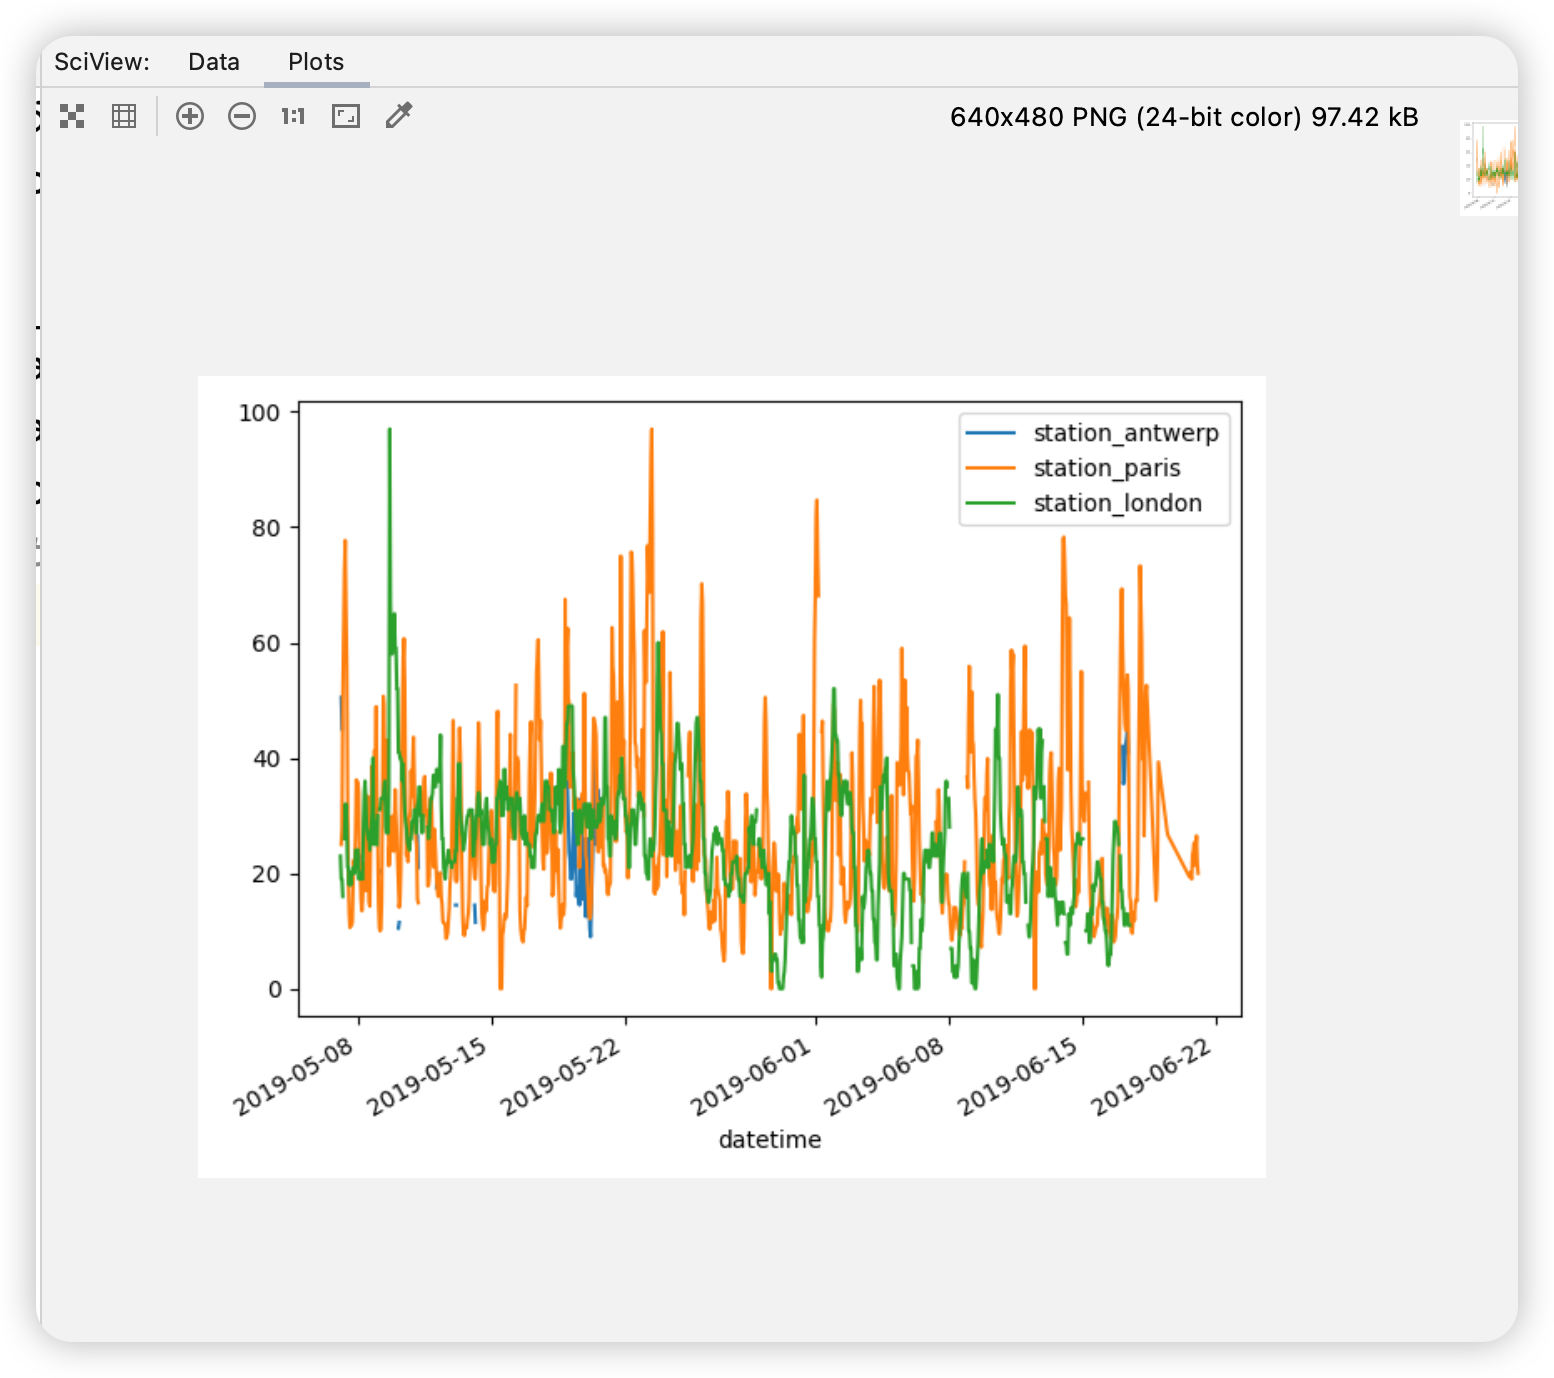
pandas 默认为DataFrame包含数字的每一列数创建一个线图。
我只想用巴黎的数据列绘制图形。

我想直观地比较NO2在伦敦和巴黎测量的值。
1 | air_quality.plot.scatter(x="station_london", y="station_paris", alpha=0.5) |
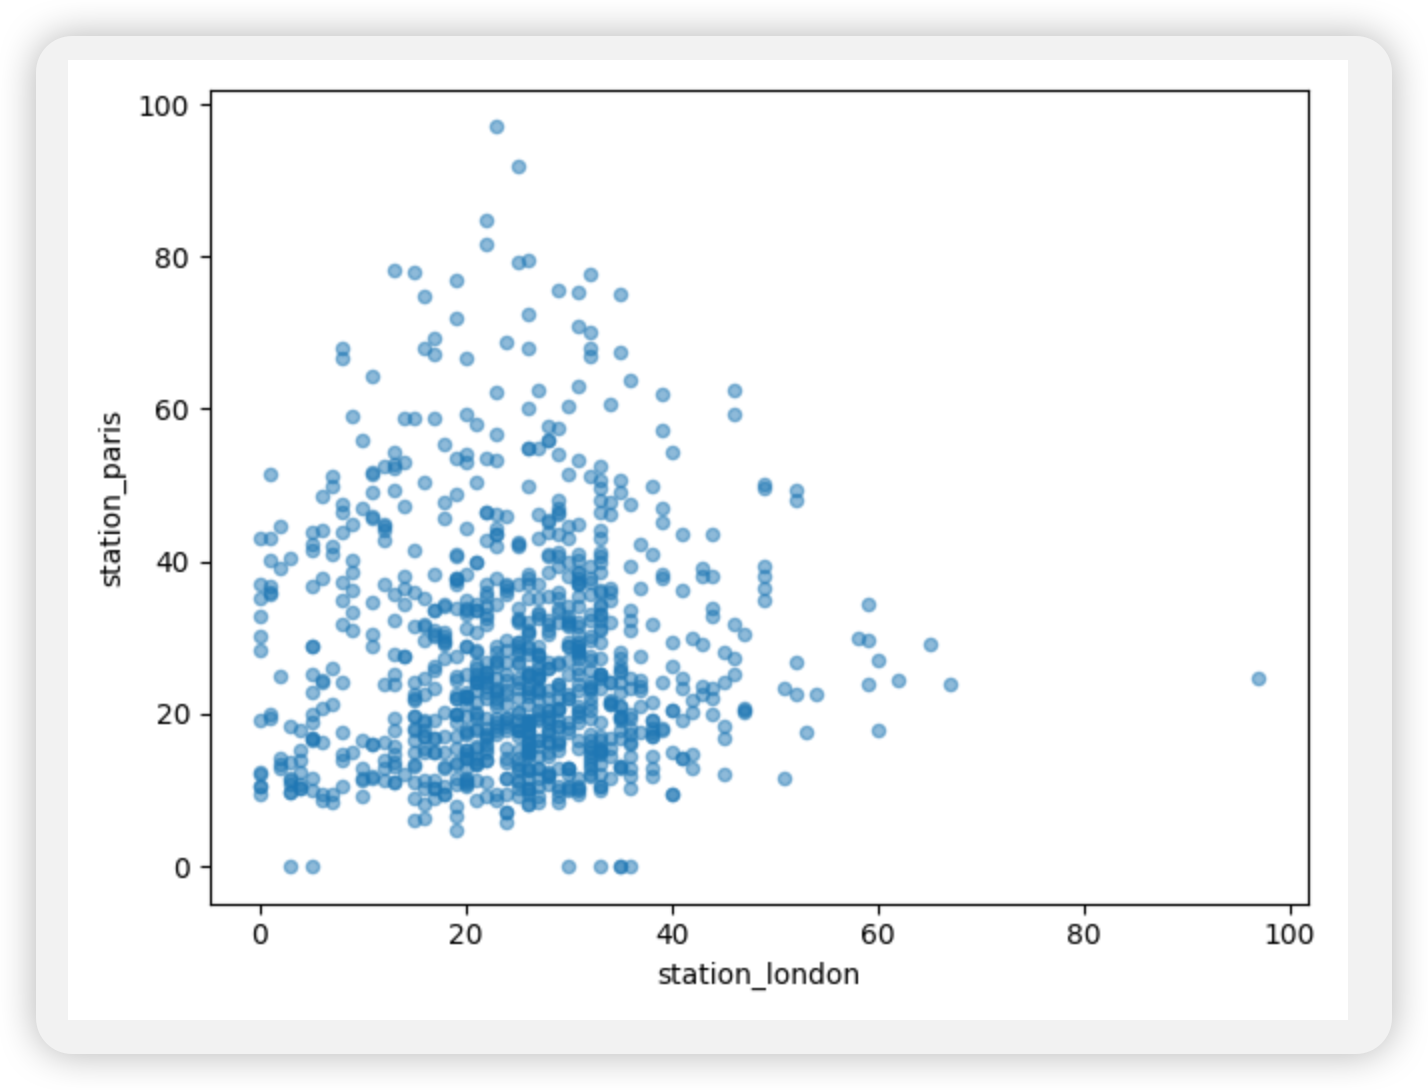
除了使用绘图功能时的默认线图之外,还可以使用许多其他图形来绘制数据。
绘图方法允许使用除默认线图之外的多种绘图样式,可以通过plot()方法的kind参数进行设置:
"bar"或"barh"绘制柱状图"hist"绘制直方图"box"绘制箱形图"kde"或"density"绘制密度图"area"绘制面积图"scatter"绘制散点图"hexbin"绘制六边形箱图-
"pie"绘制饼状图
例如,可以通过以下方式创建箱线图:
1 | air_quality.plot.box() |

我希望每一列都在一个单独的子图中。
1 | axs = air_quality.plot.area(figsize=(12, 4), subplots=True) |
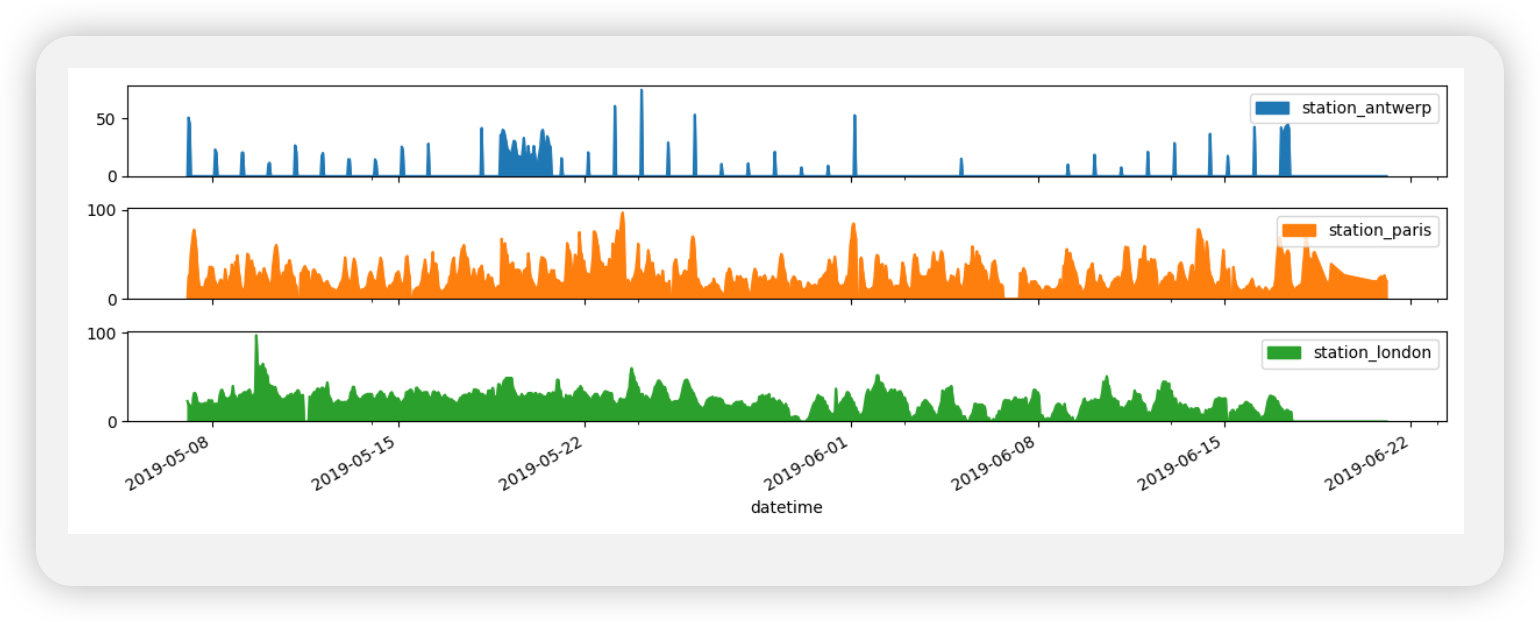
我想进一步定制、扩展或保存结果图。
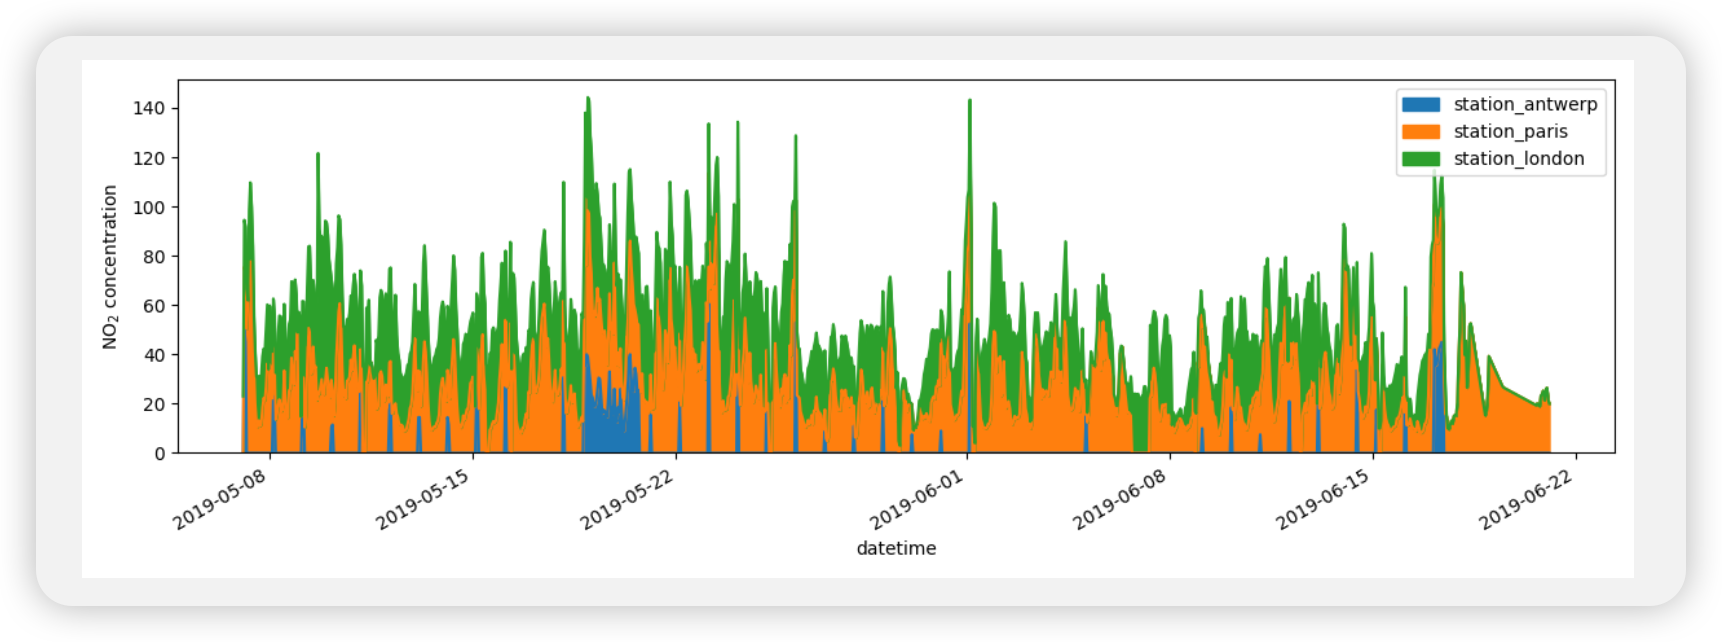
pandas 创建的每个绘图对象都是 Matplotlib对象。由于 Matplotlib 提供了大量的选项来自定义绘图,因此使 pandas 和 Matplotlib 之间的关联显式化,从而可以将 Matplotlib 的所有功能发挥到绘图上。
如何从现有列创建新列

教程数据如下:
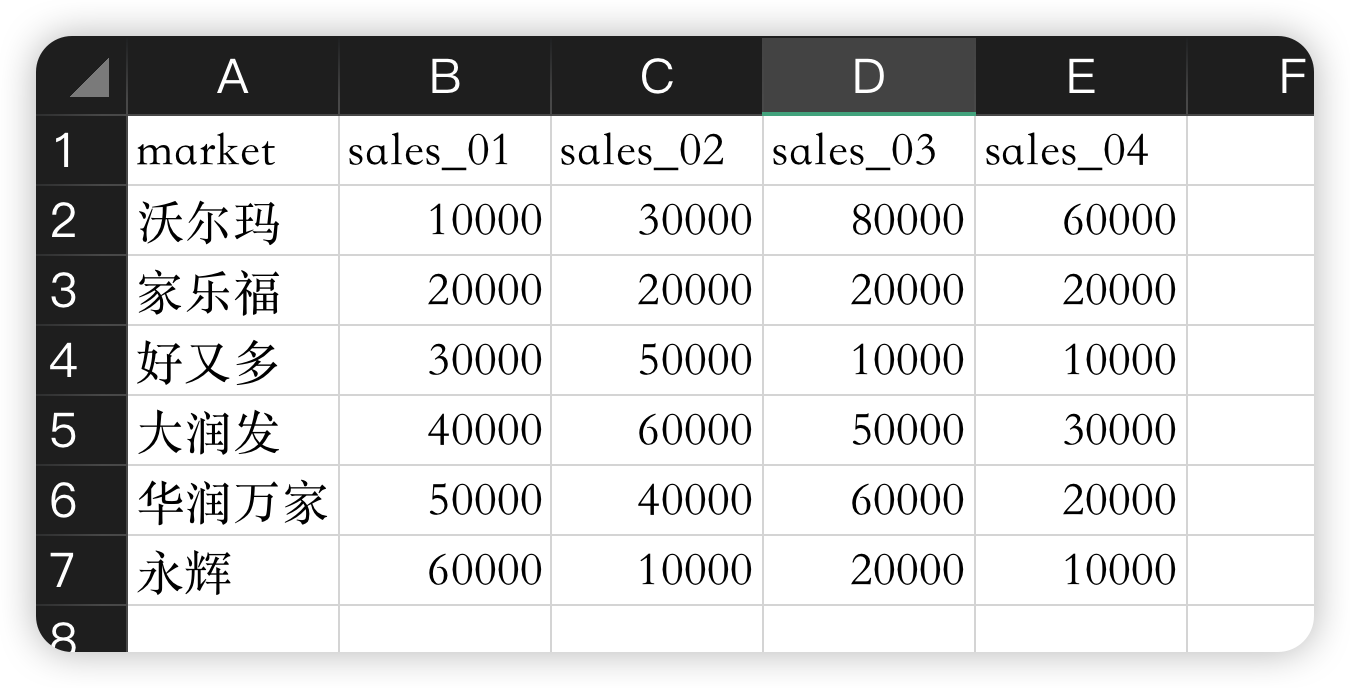
假设我们想在表格中新增一列表示所有商场第一季度的收入:
1 | market_sales["first_season_sales"] = market_sales.iloc[:, 0:4].sum(axis=1) |
Out:
1 | sales_01 sales_02 sales_03 sales_04 first_season_sales |
其他数学运算符(+、-、*、/、…)或逻辑运算符(<、>、==、…)也按此逻辑工作。
如果您需要更高级的逻辑,您可以通过apply().
如果你想对某些列名进行重命名操作:
1 | renamed_market_sales = market_sales.rename( |
Out:
1 | SALES_FIRST_MONTH ... SALES_FOURTH_MONTH |
rename()函数可用于行和列。 你需要提供一个字典,其中包含当前名称的键和新名称的值,以更新相应的名称。
映射不应仅限于固定名称,也可以是映射函数。 例如,也可以使用函数将列名转换为小写字母:
1 | renamed_market_sales = renamed_market_sales.rename(columns=str.lower) |
Out:
1 | sales_first_month ... sales_fourth_month |
如何计算汇总统计数据
数据集:本教程使用成人人口普查收入数据集。
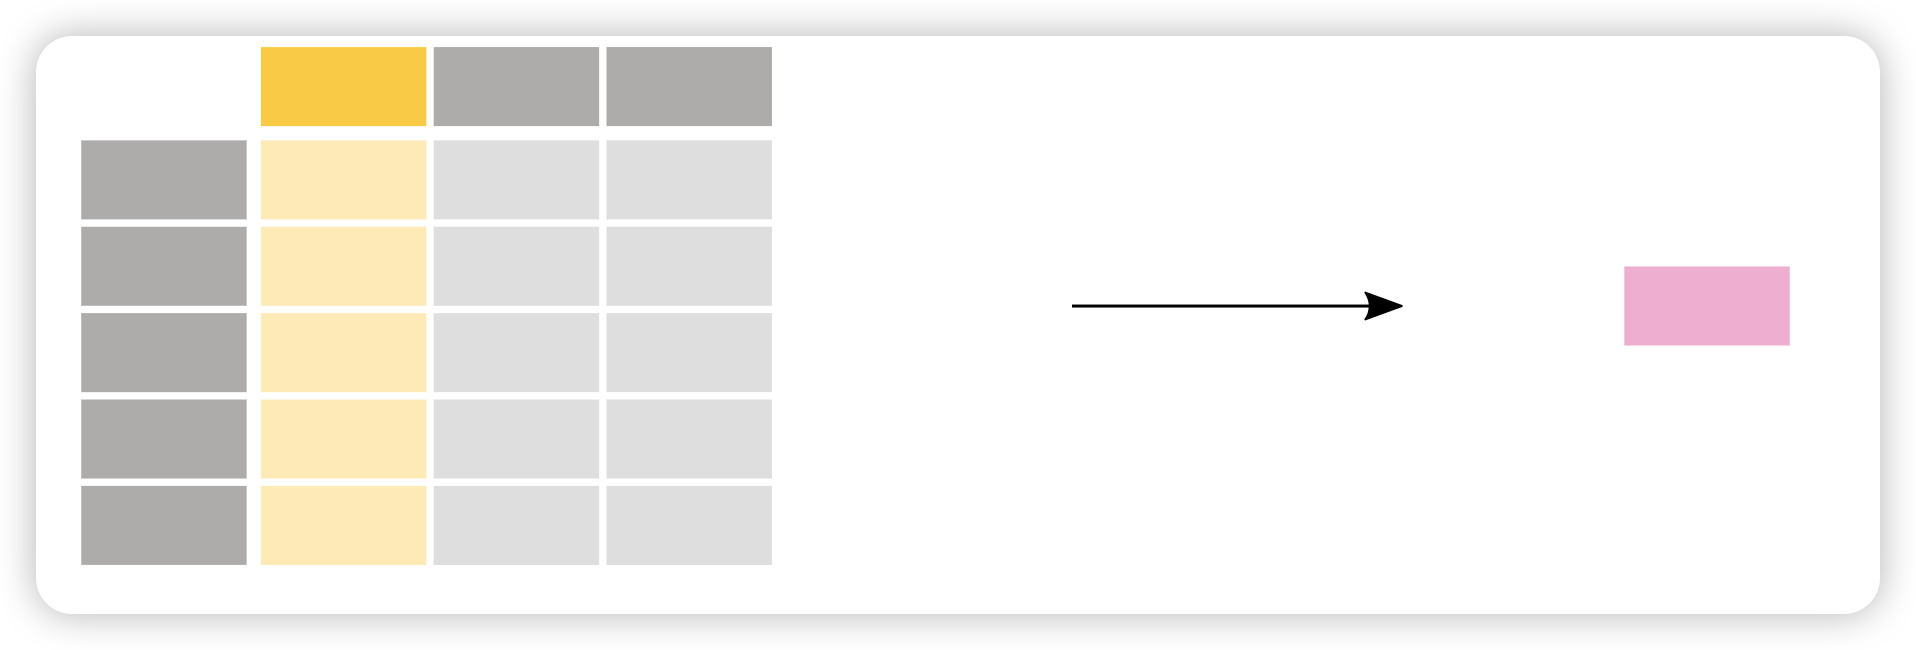
汇总统计数据
所有人员的平均年龄是多少?
1 | adult = pd.read_excel("data/adult.xlsx") |
Out:
1 | 38.58164675532078 |
可以使用不同的统计数据,并将其应用于具有数值数据的列。 一般情况下,操作会排除缺失数据并默认跨行(按列)操作。
我们可以使用median函数来计算一系列数值的中位数。这个函数可以用于计算 Series 或 DataFrame 对象中的中位数。:
1 | adult = pd.read_excel("data/adult.xlsx") |
Out:
1 | age 37.0 |
可以使用 DataFrame.agg() 方法定义给定列的聚合统计信息的特定组合,而不是预定义的统计信息:
1 | age hours.per.week |
聚合统计数据并按类别分组

统计所有男性和女性的平均年龄是多少?
1 | print(adult[["age", "sex"]].groupby("sex").mean()) |
Out:
1 | age |
由于我们感兴趣的是每个性别的平均年龄,因此首先对这两列进行子选择:titanic[["Sex", "Age"]]。 接下来,对 “Sex” 列应用 groupby() 方法,为每个类别创建一个组。 计算并返回每个性别组的平均年龄。
如果我们只对每个性别的平均年龄感兴趣,则分组数据也支持列的选择(像往常一样的矩形括号 []):
1 | print(adult.groupby("sex")["age"].mean()) |
Out:
1 | sex |

按类别统计记录数
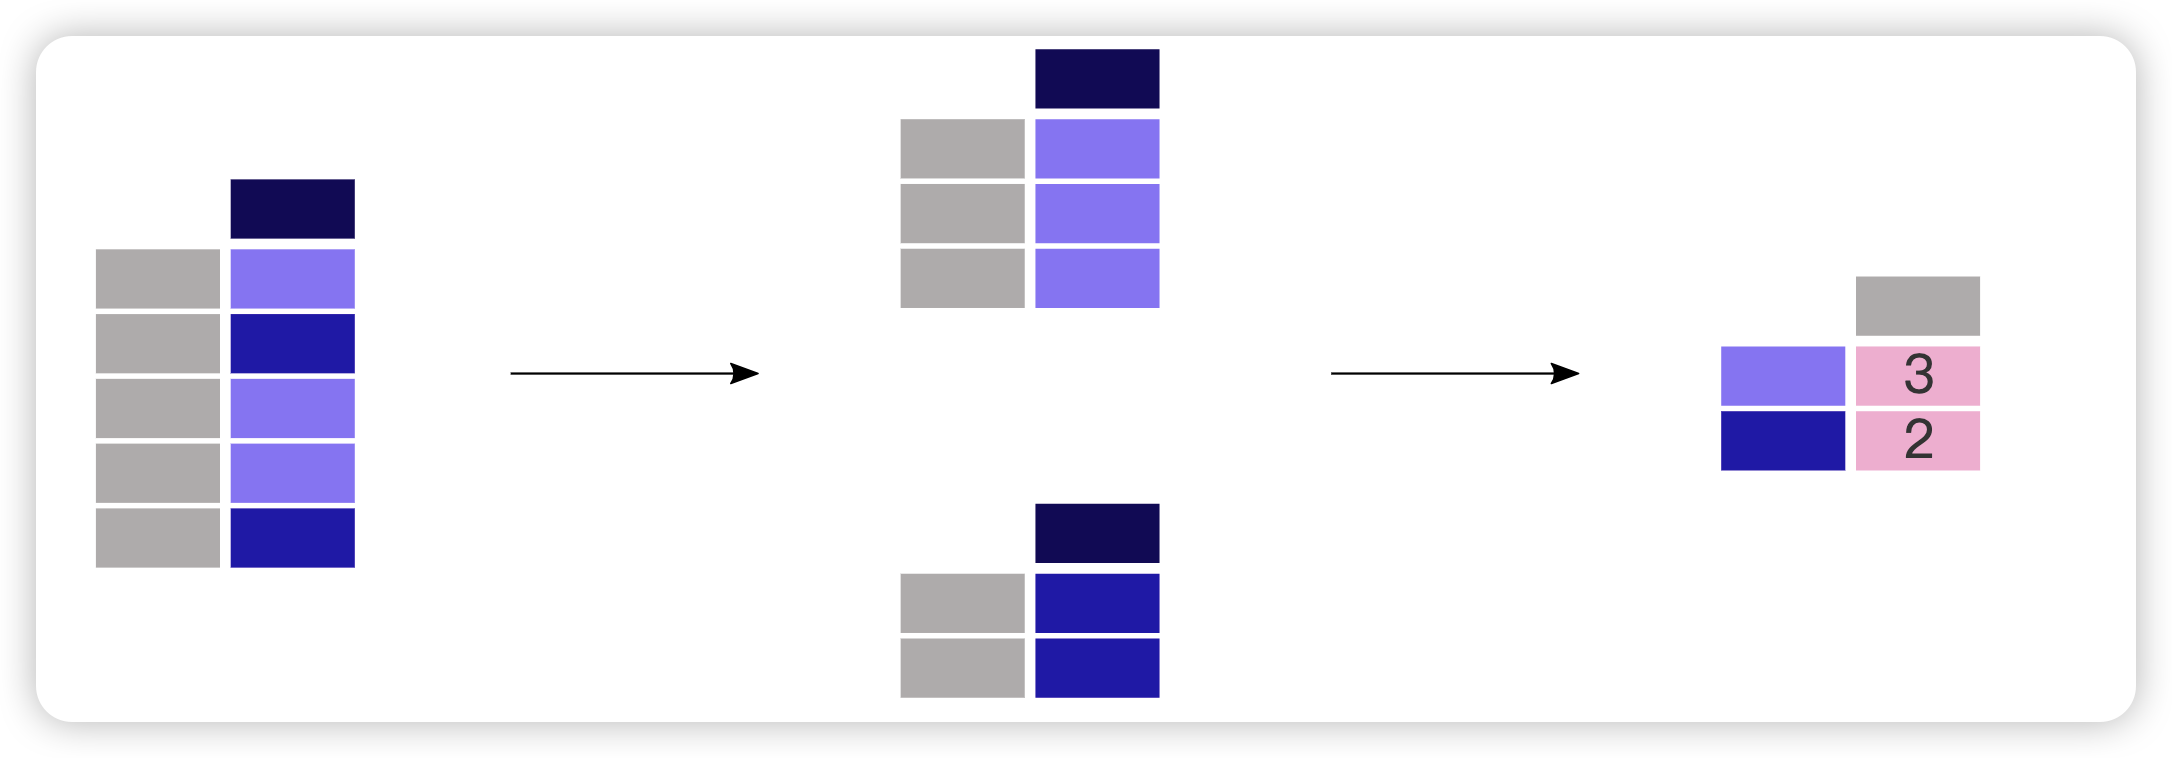
统计每个性别的人数是多少:
1 | print(adult["sex"].value_counts()) |
Out:
1 | sex |
该函数是一个快捷方式,因为它实际上是一个 groupby 操作,并结合了每组内记录数的计数:
1 | print(adult.groupby("sex")["sex"].count()) |
size和两者都count可以与 结合使用groupby。而size包含NaN值并仅提供行数(表的大小),count排除缺失值。在该value_counts方法中,使用dropna参数来包含或排除NaN值。
如何重塑表格布局
让我们使用空气质量数据集的一小部分。我们专注于 NO2数据并仅使用每个位置的前两个测量值。数据子集将被称为no2_subset。
1 | air_quality = pd.read_csv( |
Out:
1 | city country location parameter value unit |
空气质量数据集包含以下列:
- city:使用传感器的城市,巴黎、安特卫普或伦敦
- 国家:使用传感器的国家,FR、BE 或 GB
- location:传感器的 ID,FR04014、BETR801或 伦敦威斯敏斯特
- 参数:传感器测量的参数,或者NO2 或颗粒物
- value:测量值
- 单位:测量参数的单位,在本例中为“μg/m³”
DataFrame的索引是datetime测量的日期时间。
对表行进行排序
根据年龄对表格数据进行排序
1 | adult = pd.read_excel("adult.xlsx") |
Out:
1 | age workclass fnlwgt ... hours.per.week native.country income |
根据年龄和受教育等级对所有人员进行排序。
1 | adult_sorted = adult.sort_values(by=["age", "education.num"], ascending=False).head() |
1 | age workclass fnlwgt ... hours.per.week native.country income |
使用 DataFrame.sort_values(),表中的行根据定义的列进行排序。 索引将遵循行顺序。
从长到宽的表格格式
1 | air_quality = pd.read_csv( |
Out:
1 | city country ... value unit |
我希望三个站点的值作为彼此相邻的单独列。(即将某些行转换成列)
1 | print(no2_subset.pivot(columns="location", values="value")) |
Out:
1 | location BETR801 FR04014 London Westminster |
数据透视表

我想要以表格形式获取每个站NO2和PM2.5的平均浓度。
1 | air_quality_mean = air_quality.pivot_table( |
Out:
1 | parameter no2 pm25 |
数据透视表是电子表格软件中众所周知的概念。当对每个变量的行/列边距(小计)感兴趣时,请将参数margins设置为True:
1 | air_quality_mean = air_quality.pivot_table( |
Out:
1 | parameter no2 pm25 All |
从宽到长的表格格式
我们向DataFrame 加一个新索引reset_index()。
1 | no2_pivoted = no2.pivot(columns="location", values="value").reset_index() |
Out:
1 | location date.utc BETR801 FR04014 London Westminster |
我想在单列(长格式)中收集所有空气质量二氧化氮测量值。
1 | no_2 = no2_pivoted.melt(id_vars="date.utc") |
Out:
1 | date.utc location value |
DataFrame上的pandas.melt()方法将数据表从宽格式转换为长格式。 列标题成为新创建的列中的变量名称。换句话说,也就是将多列合并成一列。
pandas.melt()可以更详细地定义传递给的参数:
1 | no_2 = no2_pivoted.melt( |
上述参数的解释:
value_vars定义将哪些列融合在一起value_name为列值提供自定义列名,而不是默认列名valuevar_name为融合的列提供自定义列名称。否则它采用索引名称或默认值variableid_vars中声明的列将不会被融合id_vars声明的列不会被融合
因此,参数 value_name 和 var_name 只是两个生成列的用户定义名称。 要融合的列由 id_vars 和 value_vars 定义。
如何合并多个表的数据

现有两个班的学生数据 class_01_students.xlsx class_02_students.xlsx 如下:
class_01_students.xlsx:
1 | class_01_students = pd.read_excel("data/class_01_students.xlsx") |
Out:
1 | name age sex height blood |
class_02_students.xlsx:
1 | class_02_students = pd.read_excel("data/class_02_students.xlsx") |
Out:
1 | name age sex height blood |
将两个具有相似结构的表合并成一个表:
1 | class_01_students = pd.read_excel("data/class_01_students.xlsx") |
Out:
1 | name age sex height blood |
concat() 函数沿其中一个轴(按行或按列)执行多个表的串联操作。
默认情况下,串联是沿着轴 0 进行的,因此生成的表组合了输入表的行。 让我们检查原始表和串联表的形状来验证操作:
1 | print("shape of class_01_students:", class_01_students.shape) |
axis 参数出现在许多可沿轴应用的 pandas 方法中。 DataFrame 有两个相应的轴:第一个轴垂直向下跨行(轴 0),第二个轴水平跨列(轴 1)。 默认情况下,大多数操作(如串联或汇总统计)是跨行(轴 0)的,但也可以跨列应用。
根据年龄对表进行排序(正序):
1 | sorted_students = students.sort_values("age") |
Out:
1 | name age sex height blood |
倒序:
1 | sorted_students = students.sort_values("age", ascending=False) |
Out:
1 | name age sex height blood |
这些教程中没有提到同时存在多个行/列索引。 分层索引或 MultiIndex 是一种先进且强大的 pandas 功能,用于分析更高维度的数据。
多重索引超出了 pandas 介绍的范围。 目前,请记住函数reset_index可用于将任何级别的索引转换为列。
使用通用标识符连接表

现有学生基本信息表 class_01_students.xlsx 和学生成绩表 student_score.xlsx 如下:
基本信息表 class_01_students.xlsx :
1 | class_01_students = pd.read_excel("data/class_01_students.xlsx") |
Out:
1 | name age sex height blood student_id |
学生成绩表 student_score.xlsx :
1 | student_score = pd.read_excel("data/student_score.xlsx") |
Out:
1 | student_id chinese math english physics |
根据student_id合并两个表格:
1 | class_01_students = pd.read_excel("data/class_01_students.xlsx") |
Out:
1 | name age sex height blood student_id chinese math english physics |
mege操作类似于数据库的join操作
现学生成绩表 student_score.xlsx 和学生基本信息表 class_01_students.xlsx 没有相同的key。
学生基本信息表 class_01_students.xlsx 的数据如下:
1 | name age sex student_id |
学生成绩表 student_score.xlsx 的数据如下:
1 | stuid chinese math english physics |
连接两个表:
1 | class_01_students = pd.read_excel("data/class_01_students.xlsx") |
与前面的示例相比,没有公共列名。然而,表 class_01_students.xlsx 中的student_id列和表student_score.xlsx 中的stuid字段以通用格式提供了学生Id信息,此处使用参数left_on 和参数right_on (而不仅仅是on)来建立两个表之间的链接。
如何轻松处理时间序列数据
本教程使用的数据:空气质量数据
使用 pandas 日期时间属性
将纯文本转换成日期时间对象:
1 | air_quality = pd.read_csv("data/air_quality_no2_long.csv") |
最初,日期时间中的值是字符串,不提供任何日期时间操作(例如提取年份、星期几等)。 通过应用 to_datetime 函数,pandas 解释字符串并将其转换为日期时间(即 datetime64[ns, UTC])对象。 在 pandas 中,我们将这些类似于标准库中的 datetime.datetime 的日期时间对象称为 pandas.Timestamp。
由于许多数据集的其中一列中确实包含日期时间信息,因此 pandas.read_csv() 和 pandas.read_json() 等 pandas 输入函数可以在使用 parse_dates 参数在读取数据时将一些列日期列转换成时间戳对象。
为什么这些pandas.Timestamp对象有用?让我们通过一些示例来说明附加值。
我们正在使用的时间序列数据集的开始日期和结束日期是哪天?
1 | print(air_quality["date.utc"].min()) |
Out:
1 | 2019-05-07 01:00:00+00:00 |
使用 pandas.Timestamp 作为日期时间使我们能够使用日期信息进行计算并使它们具有可比性。 因此,我们可以用它来获取时间序列的长度:
1 | print(air_quality["date.utc"].max() - air_quality["date.utc"].min()) |
Out:
1 | 44 days 23:00:00 |
结果是一个 pandas.Timedelta 对象,类似于标准 Python 库中的 datetime.timedelta 并定义持续时间。
我想向 DataFrame 添加一个新列,仅包含月份
1 | air_quality["month"] = air_quality["date.utc"].dt.month |
Out:
1 | city country date.utc ... value unit month |
通过使用 Timestamp 对象来表示日期,pandas 提供了许多与时间相关的属性。 例如月份month,还有年份year、季度quarter……所有这些属性都可以通过 dt 访问器访问。
每个测量位置一周中每一天的平均二氧化氮浓度是多少?
1 | print(air_quality.groupby( |
Out:
1 | date.utc location |
还记得统计计算教程中 groupby 提供的分割-应用-组合模式吗?在这里,我们想要计算给定的统计数据(例如每周每个测量地的二氧化碳的平均浓度)。为了按工作日进行分组,我们使用 pandas Timestamp 的 datetime 属性 weekday(星期一 = 0 和星期日 = 6),也可以通过 dt 访问器访问。 可以对地点和工作日进行分组,以拆分每个组合的平均值计算。
将所有站点的时间序列中一天中典型的 NO2 模式绘制在一起。 换句话说,一天中每个小时的平均值是多少?
1 | fig, axs = plt.subplots(figsize=(12, 4)) |

日期时间作为索引
在重塑教程中, pivot()介绍了如何重塑数据表,将每个测量位置作为单独的列:
1 | no_2 = air_quality.pivot(index="date.utc", columns="location", values="value") |
Out:
1 | location BETR801 FR04014 London Westminster |
通过旋转数据,日期时间信息成为表的索引。一般来说,将某列设置为索引可以通过该
set_index函数来实现。
使用日期时间索引(即DatetimeIndex)提供了强大的功能。例如,我们不需要dt访问器来获取时间序列属性,而是直接在索引上使用这些属性:
1 | print(no_2.index.year) |
Out:
1 | Index([2019, 2019, 2019, 2019, 2019, 2019, 2019, 2019, 2019, 2019, |
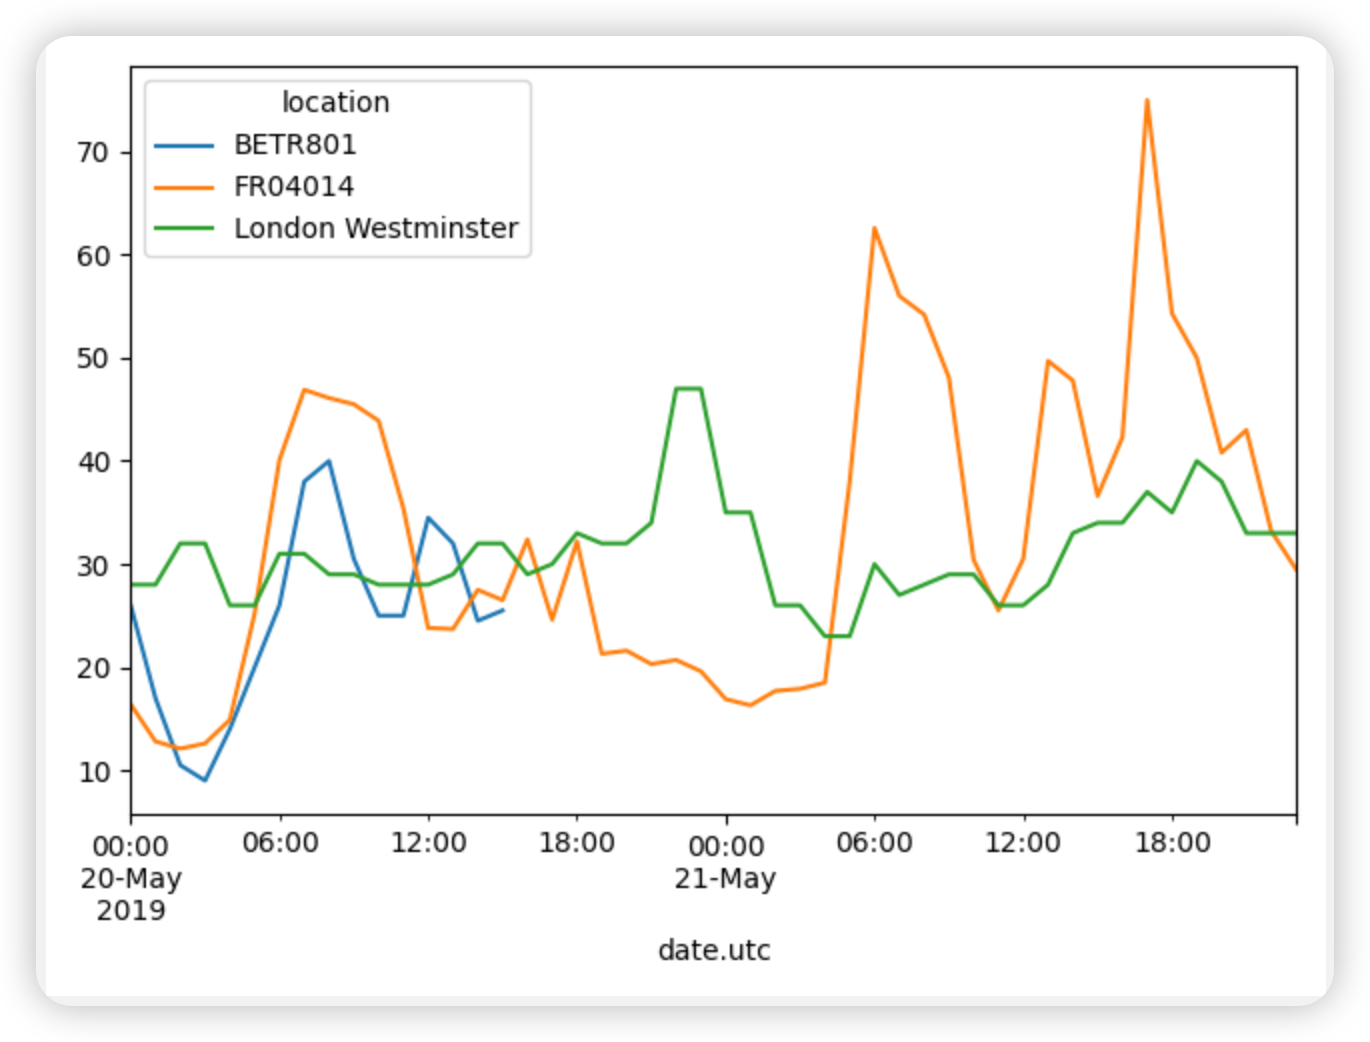
绘制5 月 20 日至 5 月 21 月底不同站点的 NO2 值。
1 | no_2 = air_quality.pivot(index="date.utc", columns="location", values="value") |
如何操作文本数据
本教程数据class_01_students.xlsx:
1 | class_01_students = pd.read_excel("data/class_01_students.xlsx") |
Out:
1 | name age sex student_id |
将name设为小写。
1 | class_01_students = pd.read_excel("data/class_01_students.xlsx") |
Out:
1 | 0 san zhang |
与时间序列教程中具有 dt 访问器的日期时间对象类似,使用 str 访问器时可以使用许多专用字符串方法。 这些方法通常具有与单个元素的等效内置字符串方法匹配的名称,但按元素应用到列的每个值。
通过提取逗号之前的部分来创建一个新列“姓氏”,其中包含乘客的姓氏。
1 | class_01_students["surname"] = class_01_students["name"].str.split(" ").str.get(1); |
Out:
1 | name age sex student_id surname |
使用该Series.str.split()方法,每个值都作为 2 个元素的列表返回。第一个元素是空格之前的部分,第二个元素是空格之后的部分。
假如我们只对姓名中带有”Tian”字的用户感兴趣:
1 | print(class_01_students["name"].str.contains("Tian")) |
Out:
1 | 0 False |
方法Series.str.contains()检查列中的每个值(Name如果字符串包含单词Tian,并返回每个值True(Tian是name的一部分)或 False(Tian不是name的一部分)。
支持更强大的字符串提取,因为
Series.str.contains()和Series.str.extract()方法接受正则表达式,但超出了本教程的范围。
哪位用户的名字最长?
1 | print(class_01_students["name"].str.len().idxmax()) |
Out:
1 | 0 |
为了获得最长的名称,我们首先必须获得列中每个名称的长度Name。通过使用 pandas 字符串方法,该 Series.str.len()函数将单独应用于每个名称(按元素)。
接下来,我们需要获取表中名称长度最大的对应位置,最好是索引标签。 idxmax() 方法正是这样做的。 它不是字符串方法,适用于整数,因此不使用 str。
根据行 ( 0) 和列 ( name) 的索引名称,我们可以使用运算符进行选择loc:
1 | print(class_01_students.loc[class_01_students["name"].str.len().idxmax(), "name"]) |
Out:
1 | San Zhang |
在“sex”列中,将“男”的值替换为“M”,将“女”的值替换为“F”。
1 | class_01_students["sex"] = class_01_students["sex"].replace({"男":"M", "女":"F"}) |
Out:
1 | name age sex student_id |
虽然replace()它不是字符串方法,但它提供了一种使用映射或词汇表来转换某些值的便捷方法。它需要dictionary来定义映射。{from : to}
关于Pandas的更多教程请访问:https://pandas.pydata.org/pandas-docs/stable/getting_started/tutorials.html。